A Workforce Support Platform
Supporting employees manage life challenges and prevent burnout before they become absence, underperformance, turnover — and avoidable financial loss
Parentica gives every employee a private, specialist-led place to find their next step — day or night, in their own language, on any device.
High-performance companies depend on high-performing people.
Parentica supports companies in reaching their goals — low turnover, a stable workforce, and continuously high-performing employees who drive development and growth.
Paradoxically, the very teams that perform the best often carry the heaviest load. High-performing companies routinely see turnover and burnout rates above the branch average among their most engaged employees — the ones delivering the results everyone depends on.
Need
What employees carry affects how work gets done.
Behind every missed deadline and quiet departure is a real, human load — stress, a family crisis, a sleepless week — quietly reshaping attention, decisions and output, long before it reaches any report.
One employee
Daily stress at work
of employees worldwide report significant stress on a typical working day
reported stress, trending up
Gallup, State of the Global Workplace
Support
This is the Parentica platform for your employees.
A private space where every employee learns, grows and thrives at their own pace — guided by Pari, certified as they progress, and built around the real rhythm of a working life.
Welcome back, Alex
Your space to learn, grow, and thrive — at your own pace.
47
Started
of 400+ courses
12h 40m
Hours Learned
last 2 weeks
12
Certificates
earned
18
AI Chats
this month
Browse Courses
Explore 400+ courses
Pari
Your personal guide
Chat History
Reopen conversations
Daily Inspiration
A new post every day
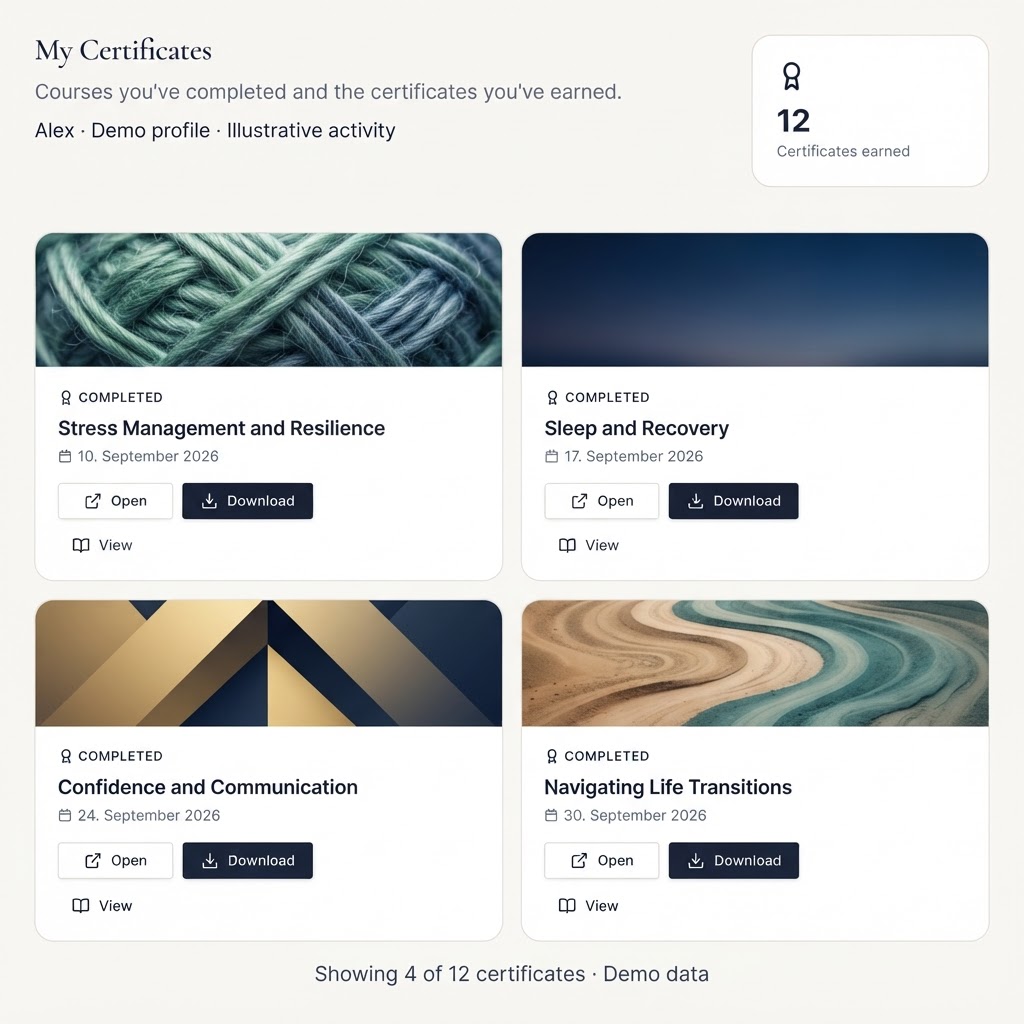
Certificates
12 certificates earned
How It Works
Tour the platform
Terms & Privacy
Legal notice
Settings
Account & preferences
Leave a Review
Share your feedback
Continue Learning
9 in progress
Every employee — in their own language
Coverage is not limited to this list — new languages are added continuously.
Meet Pari
Pari — every employee's own personal guide.
Pari is a private AI guide assigned to each individual employee — their own dedicated companion for learning and growth. It meets every person exactly where they are, turning a quiet worry into a clear next step: a tailored 30-day plan, a seven-step quick start, or the right course for their stage of life. Private, confidential, and available in their own language, day and night.
Hi, I'm Pari
Your personal guide — here whenever you need me
I'm here to help, guide, and support you through all of life's obstacles and questions. Anything is possible — let's start with what feels right for you.
Start my 30-day action plan
A structured plan tailored to where you are right now — with clear steps you can begin today.
7-step quick start guide
Practical first steps you can take right away — clear, simple, and grounded in research.
Find courses for my life stage
Top-rated courses from our library, matched to where you are in life right now.
Pari is a supportive guide, not a medical professional or therapist. For medical or mental health emergencies, contact your local emergency services.
Pari
Your personal guide through every stage of life · Any language
Stockholm
Overcast · 14°
Oslo
Clear · 12°
Copenhagen
Light rain · 13°
London
Partly cloudy · 16°
Berlin
Breezy · 15°
How can I help you today?
I'm Pari — your personal guide through every stage of life, in any language. Ask me anything about life, wellbeing, relationships, or personal growth. I have access to your full course library, ebooks, and audio content.
Private by design
Only the employee sees their own space
Grounded in specialist research
Every course backed by expert insight
Aggregate reporting only
Never individual — by design
Available day & night
In their own language, on any device
Capacity
Support helps people regain clarity, confidence and sustainable capacity.
Step by step, employees rebuild the focus and energy that stress quietly consumed. Progress is theirs to see — a dashboard of completed courses, time invested and confidence returning — which is how new capacity takes root.
6–8 weeks
is when managers typically start to see the strain lift and performance return.
Parentica programme experience, 2026.
Absenteeism ↓
$312k
−38% recovered
Turnover ↓
$184k
−27% retained
Performance ↑
+19%
productivity lift
Absenteeism — days lost to absence
12.6 → 7.8 days / employee / yr
Performance — sustainable capacity
index 78 → 93
| Outcome | Start | M12 | Change |
|---|---|---|---|
| Turnover rate | 22% | 16% | Decrease 6% |
| Absenteeism | 13 | 8 | Decrease 5 |
| Presenteeism | 31% | 22% | Decrease 9% |
| Performance | 78 | 93 | Increase 15 |
| Overall health | 61 | 79 | Increase 18 |
| Feeling of care & value | 42 | 84 | Increase 42 |
| Employee loyalty | 54 | 80 | Increase 26 |
Illustrative trajectory — fictional demo data, not customer results.
Responded
3,882
of 3,903 — 99.5%
Within 48h
99.5%
avg response time
Reach
3,903
employees invited
Round 1 vs Round 2 — 3 months apart
Engagement score — across two survey rounds
58 → 87 (R1 → R2)
3,903
Sent
3,894
Opened
3,882
Responded
3,819
Completed
Illustrative participation data — fictional demo figures, not customer results.
Workforce Outcomes
Leaders see earlier signals, not only late outcomes.
Anonymous, aggregate insights arrive before a crisis becomes absence or departure. Leaders see capacity, stress and engagement trends early enough to act — while individual responses stay strictly private.
Aggregate
insights are reported at company or department level — never per individual.
Parentica confidentiality framework.
Parentica surfaces stress and capacity weeks before absence or turnover appears in HR systems.
Stress
self-reported load
Visible 3w before late outcome
Capacity
sustainable pace
Visible 7w before late outcome
Engagement
motivation pulse
Visible 12w before late outcome
Wellbeing
composite index
Visible 5w before late outcome
Company level
Whole-org trends, min 10 employees
Department level
Team trends, min 10 per group
Individual level
Never reported to employer
Aggregate reporting only — no individual is identifiable from any Parentica report.
Why a single platform
Wellness apps and HR software each solve half the problem — employees and employers never see the full picture.
Consumer wellbeing apps reach the individual but share almost nothing back with the employer. HR platforms manage company data but do little to support an employee's everyday life. Parentica is the only platform that combines self-help life tools with anonymous aggregate analytics, surveys and KPI reporting — so companies can act proactively, not reactively.
Consumer wellness apps
Self-help style apps employees are expected to use on their ownHeadspace
Meditation / mindfulness app
Built for personal use, not company insight
Users who stop within 30 days
~96%
churn metrics across health & fitness apps
Company-level analytics
None
no employer dashboard, no aggregate KPI reporting
- No anonymous aggregate reporting for employers
- No workforce wellbeing metrics or KPI trends
- Low sustained engagement — app used alone, no employer activation
App abandonment: health apps lose ~96% of users within 30 days (industry retention data).
Calm
Wellbeing / sleep app
Popular content, little employer visibility
Users who stop within 30 days
~96%
churn metrics across health & fitness apps
Aggregate workforce reporting
None
no employer-facing KPI metrics
- No aggregated headcount-level trends for your team
- No surveys or wellbeing questionnaires for employers
- Engagement depends entirely on each person remembering to open it
Health app churn: ~70% of users discontinue within the first 100 days; median retention at day 30 is 3–12% (scoping review, 2024).
Happify / generic apps
Wellness / habit apps
High churn, no data back to the business
Users who stop within 30 days
~96%
churn metrics across health & fitness apps
Company-level insight
None
no employer-facing analytics
- No employer dashboard of utilisation or outcomes
- No measurement of absenteeism, turnover or presenteeism
- Success is unseen — nothing reported back to the company
66% of health apps and 69% of fitness apps are abandoned within 90 days (scoping review, 2024) — worse than the 52% average across all app categories.
HR platforms for employers
Back-office HR software — operate the backend, not the wellbeingWorkday
HRIS / workforce platform
Manages HR records, not employee wellbeing support
Employees actively using the HRIS
~32%
even after implementation, per Gartner
Self-help life & wellbeing tools
None
no courses, no AI life support
- No employee self-help life tools or courses
- No wellbeing surveys or aggregate wellbeing metrics
- Reports on HR data — attendance and payroll — not on workforce wellbeing or proactive signals
Average HRIS is used by only ~32% of employees (Gartner, 2022); nearly 1 in 4 organisations find HR tech fails to meet adoption expectations (SHRM).
BambooHR
HRIS / HR software
Back-office HR tool, limited wellbeing support
Employees actively using the HRIS
~32%
even after implementation, per Gartner
Aggregate wellbeing KPI reporting
Limited
surveys exist, but no expert-led self-help support
- No specialist-led employee wellbeing education
- No AI-assisted guidance or on-demand self-help for employees
- No measurement linking wellbeing to absenteeism, turnover and presenteeism
Average HRIS is used by only ~32% of employees (Gartner, 2022).
Parentica
The integrated optionIntegrated employee wellbeing platform
One platform: self-help life tools AND aggregate metrics
All-in-one for employees
Yes
self-help courses, AI guidance, wellbeing questionnaires
Aggregate reporting for employers
Yes
anonymous, KPI-driven, measured — not assumed
- Self-help life tools employees actually use — expert-led, AI-supported
- Surveys, wellbeing metrics and KPI trends reported in aggregate, never per individual
- Proactive, data-informed actions to lower absenteeism, turnover and presenteeism
- Everything an employer needs in one connected platform, not a patchwork
Parentica integrated delivery — measured, aggregate reporting by design.
Sources — every figure can be verified
- App abandonment: "When and Why Adults Abandon Lifestyle Behavior and Mental Health Mobile Apps: Scoping Review" (2024) — 66% of health apps and 69% of fitness apps abandoned within 90 days; median abandonment ~70% within the first 100 days; day-30 retention for health & fitness apps commonly 3–12%. Available on PubMed Central (PMC11694054).
- 30-day churn: Industry retention data — health apps lose ~96% of users within 30 days; fitness apps retain just 3–4% at day 30 (Sahha / industry retention benchmarks).
- HRIS adoption: Gartner (2022) — the average HRIS is used by only ~32% of employees; SHRM — nearly 1 in 4 organisations find HR tech implementations fail to meet adoption expectations; Capterra — SMBs use ~5 HR tools, with one-third not regularly used.
- Measurement gap: Wellhub 2026 Return on Wellbeing Report — only ~61% of companies measure the ROI of their wellness programmes; low engagement and difficulty measuring impact are among the top barriers. RAND Corporation — $3.78 saved per $1 invested in chronic-disease management, when actually measured.
- Wellbeing ROI when measured: Harvard meta-analysis — ~$3.27 medical-cost savings and ~$2.73 absenteeism-cost savings per $1 invested; Johnson & Johnson reported ~$2–4 returned per $1. The problem isn't that support has no return — it's that most tools never measure it.
Figures are estimates from the cited sources and are shown for comparison. Cross-market churn statistics vary by study and app category. Parentica effectiveness should be assessed on your own measured, anonymous aggregate data.
The scale of the problem
Employee health, worldwide — the scale of the problem
The challenges Parentica addresses are not local or niche. They are the largest measurable drivers of lost productivity, absenteeism and turnover in workforces across the world. Below are five global statistics — each verifiable, each linked to a dimension Parentica's ROI model measures.
| Dimension | Figure | What it measures | Scale |
|---|---|---|---|
| Burnout worldwide | 76% | 76% of employees experience burnout at least sometimes; ~28% 'very often' or 'always'. | |
| Depression & anxiety | $1T | anxiety & depression cost the global economy ~$1 trillion in lost productivity annually. | |
| Disengaged workforce | 79% | only 21% engaged; 18% actively disengaged. | |
| Stress at work | 44% | 44% of employees worldwide report daily stress, the highest level Gallup has measured. | |
| Mental health absence | 12d | mental health problems cause ~12 lost workdays per affected employee per year. |
Burnout worldwide: Gallup — 76% of employees experience burnout at least sometimes; ~28% 'very often' or 'always'.
Depression & anxiety: WHO / Lancet — anxiety & depression cost the global economy ~$1 trillion in lost productivity annually.
Disengaged workforce: Gallup State of the Global Workplace 2023 — only 21% engaged; 18% actively disengaged.
Stress at work: Gallup — 44% of employees worldwide report daily stress, the highest level Gallup has measured.
Mental health absence: OECD — mental health problems cause ~12 lost workdays per affected employee per year.
5 dimensions Parentica's ROI model measures. Figures are public worldwide statistics from the cited sources, shown for context — Parentica performance should be measured on your organisation's own anonymous aggregate data.
What Parentica measures
The ROI model measures 18+ dimensions — with worldwide stats
Most ROI tools measure two or three dimensions. Parentica models 18+, because that is where the real money is. Each is paired with a verifiable worldwide statistic — so every figure can be checked, and every decision-maker can see the scale of what's at stake.
18 dimensions across 6 groups — Absence & time · Presenteeism & performance · Turnover & talent · Errors & innovation · Spend & waste · Health & culture. Figures are public worldwide statistics from the cited sources, shown for context. Parentica performance should be measured on your organisation's own anonymous aggregate data.
Calculate your potential savings
See what specialist support could return to your business.
Enter a few figures about your organisation to see the estimated cost of absence, turnover and presenteeism — and what a specialist-led platform could return. We'll email a verification code to confirm your inbox before revealing your precise estimate and sending your PDF.
The Pari difference
Most apps lock how much help a person can get. Pari doesn't.
Typical wellness apps hand every employee the same fixed path: a handful of modules, pre-written tips, and a loop that quietly ends. Feedback is one-directional and capped. Pari is a different kind of guide — a personal conversation that adapts to each employee, with no ceiling on how much information, support or feedback they can reach for.
| Trait | Figure | What it means | Scale |
|---|---|---|---|
| Conversational, not pre-set | 24/7 | Real dialogue. Ask any way you like — Pari answers in context. | |
| Unlimited depth | ∞ | No module limit, no script loop. Employees can go as deep as they need. | |
| Private by design | 100% | Only the employee sees their own conversation. Never reported individually. | |
| Day and night | 0 min | Available when stress or questions arrive — not on a helpdesk schedule. | |
| In their own language | 20+ | Swedish, English, Norwegian, Danish, German and more — natural speech. |
Locked apps
The old way- Fixed modules — a set path, the same for everyone
- Limited feedback — pre-written, no real conversation
- Caps on content — a few courses, then it loops
- No memory of what the person actually needs next
Pari
No ceiling- Asks and listens — a real back-and-forth, in plain language
- Adapts to the individual — stage of life, workload, goals
- Builds a tailored plan, then adjusts it as things change
- Pulls the right course, worksheet or next step on demand
- Gives as much or as little as the person wants — no cap
"A pre-set app stops where its script ends. Pari keeps going — as deep as the person in front of her needs to go."
The Parentica principle
See Pari for your workforceBusiness Value
A more supported workforce protects capacity and reduces avoidable cost.
When the load lifts, the numbers follow: fewer missed days, steadier performance, less manager fire-fighting and quieter turnover. Support is not a cost line — it protects the ones you already carry.
| Measure | Figure | What it means | Scale |
|---|---|---|---|
| Global cost of unsupported employees | $1T | lost every year to depression and anxiety alone in lost productivity | |
| Protected capacity | +32% | clarity and energy return to the workday | |
| Fewer avoidable costs | −41% | absence, turnover and manager overload decline | |
| A workforce that performs | 4 in 5 | supported people stay, engage and deliver |
World Health Organization, 2023 · IBI / Gallup benchmarks. Figures are public worldwide statistics shown for context — Parentica performance should be measured on your organisation's own anonymous aggregate data.
Plan a measurable pilot
Explore a measurable pilot.
Discuss your employee group, support needs and measurement plan with the Parentica team. Agree the scope before deciding whether to proceed.
Review your current absenteeism, turnover, and performance risk
Understand where manager time and productivity are being lost
Agree a baseline, privacy safeguards and relevant success measures
Explore platform access, rollout, and branding options
Receive a confidential proposal tailored to your organisation
Direct contact
info@parentica.appFAQ
Questions from
decision-makers like you.
Commercial
4 questionsPrivacy & Security
4 questionsPlatform & Content
8 questionsROI & Impact
6 questions